WMS


The power of data analysis in Business Central: Deep insights with pivot mode
25 Jan 2024
4 min read
Data analysis is critical for logistics service providers. It helps you control your logistics processes and take them to the next level. By analyzing data properly, you can work more efficiently and adapt quickly to the rapidly changing logistics landscape. Many logistics service providers are good at what they do. But the road to good data analytics is not always easy. In 3PL Dynamics, the path is fast and easy! A few weeks ago, we wrote a blog about what the Analysis feature is and how to use it. In this follow-up, we will explain how you can analyze data in a targeted way using the pivot mode in Business Central, with the ability to share this pivot table with your colleagues.
Pivot Mode: A powerful tool for data analysts
Consider Pivot Mode your trusted guide to the world of data. It allows you to efficiently categorize and subcategorize data. And it is similar to Excel’s Pivot Tables. You can use it to perform many useful, in-depth analyses. For example:
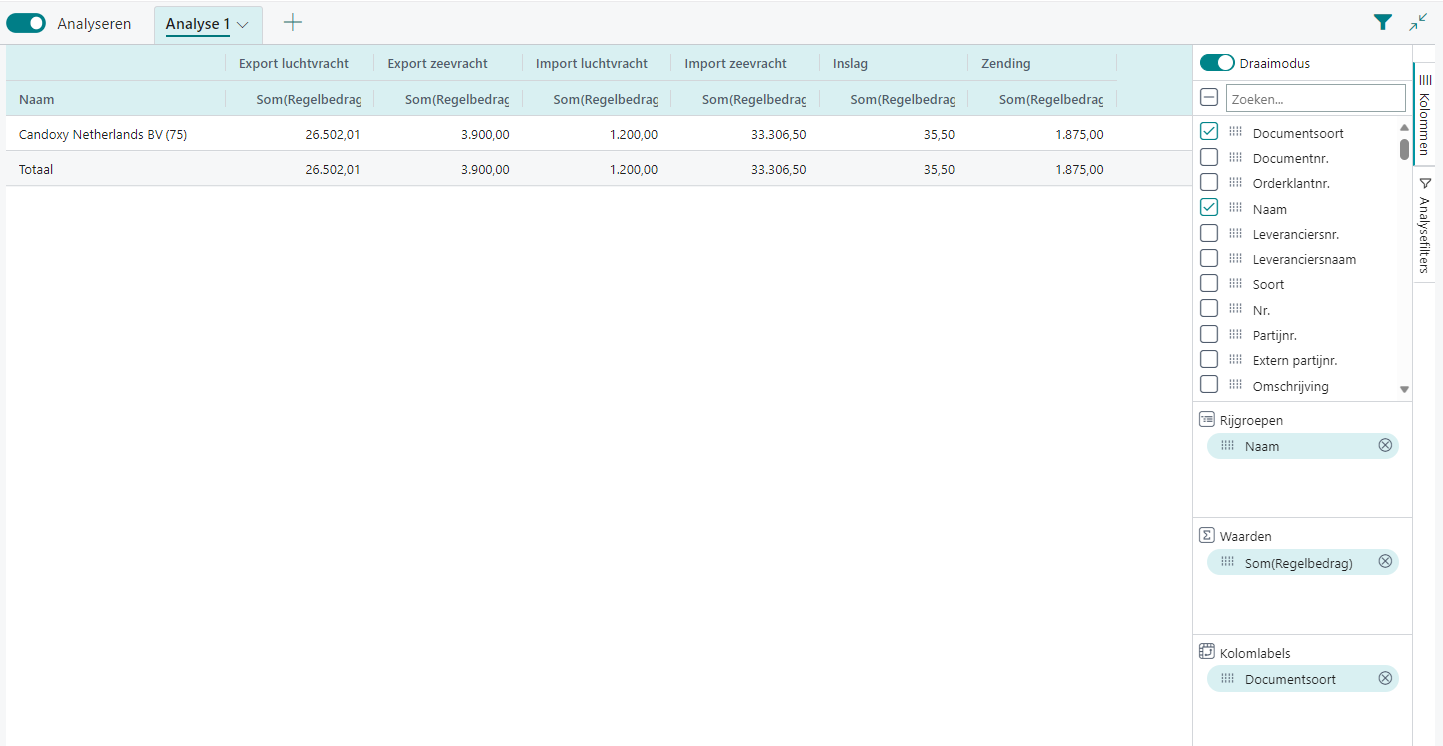
1. Document row analysis: Quickly browse totals of invoiced amounts by customer and document type.
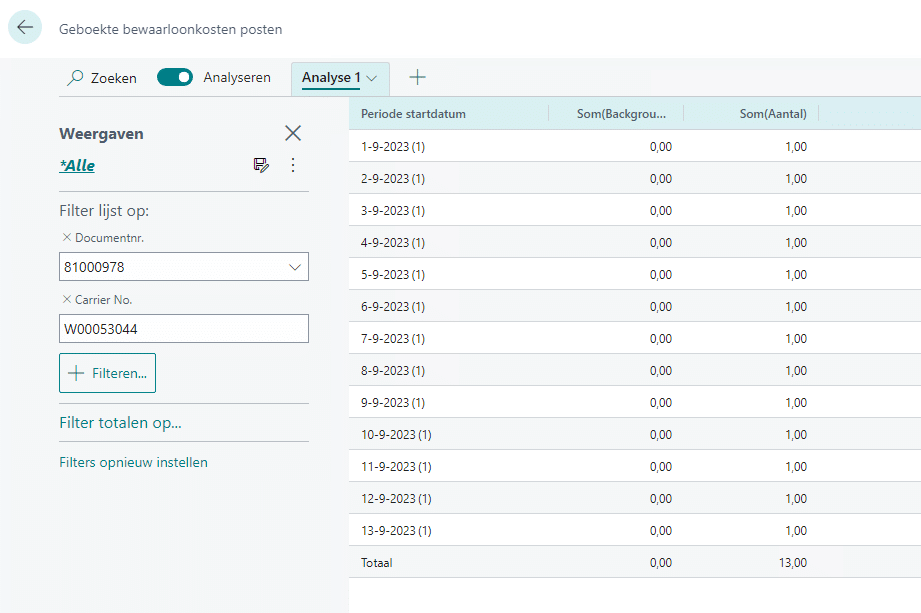
2. Deposit line item analysis: Go through the pallets on an invoice and see how far they get to the end of the month.
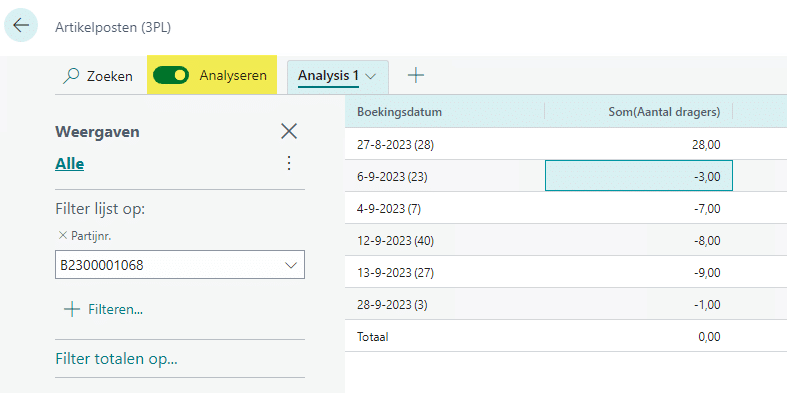
3. Item entry: Sprint through inventory data and find out when the action occurred.
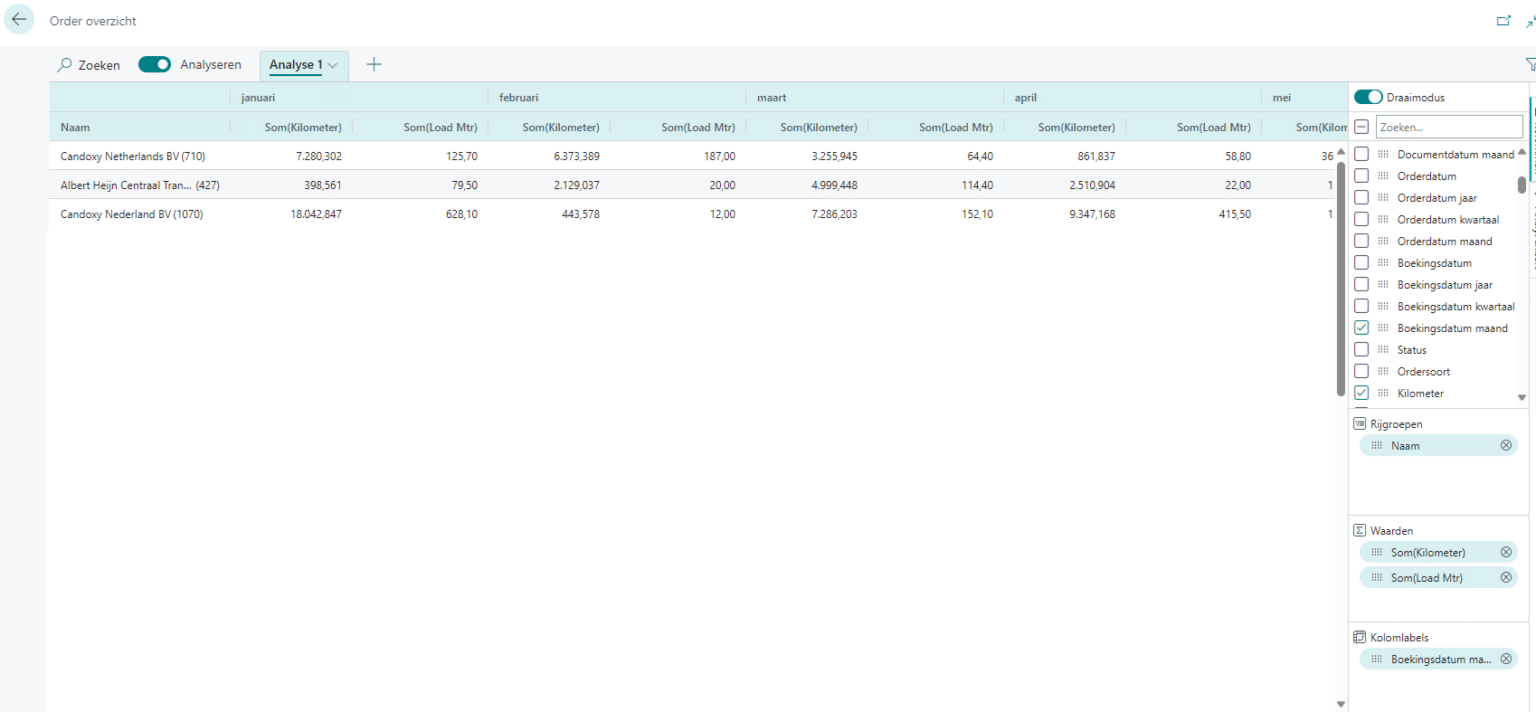
4. Transport orders: Measure your mileage or load miles per customer per month for goods moved.
First, filter the data you want!
Since the analysis mode is activated at the touch of a button, it is important to note that if you have a table with a large content, you should first set one or more filters. This will speed up the data analysis. But don’t worry if you forget to set filters, because you will get a warning.
After activating the Analysis mode, the pivot mode button becomes available. Once the pivot mode is enabled, the Column Labels area appears in the panel. Use this area to group row subtotals into categories. The fields you add to the Column Labels pane appear as columns in the data pane. To summarize, there are three steps you must follow to effectively analyze your data:
1. Set up filters.
2. Enable the analysis mode
3. Enable pivot mode
Structuring your data analysis
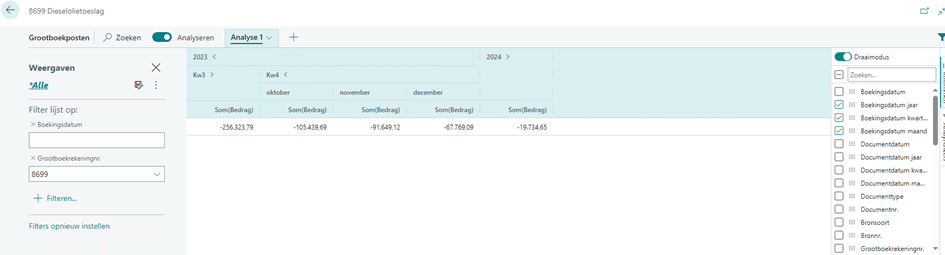
As you build your data analysis in Pivot mode, the fields seamlessly merge into three areas: Row Groups, Column Labels, and Values. The image below shows the placement of fields in the data pane. But we can better illustrate this with a real-world example. Imagine you are doing a financial analysis of the last few years. Instead of presenting an overwhelming amount of information, you can use Pivot mode to display the data in a structured and organized way. For example, you have three columns: year, quarter, and month. Using Pivot mode, you can collapse these columns together, initially showing only the total. But this is where the power of Pivot Mode really comes into play. By simply clicking on the triangles that represent the columns, you can expand the data and see detailed information by year, quarter, and month. This not only gives you a quick overview, but also allows you to zoom in on specific time periods as needed. The result is a flexible and intuitive way to perform complex analysis, revealing the details you need without overwhelming you.
Share your data analysis insights
If you have performed an interesting analysis and would like to share your findings with colleagues, you can easily do so by following these 5 steps:
1. Navigate to the Analysis tab, click the down arrow, and select ‘Copy Link’.
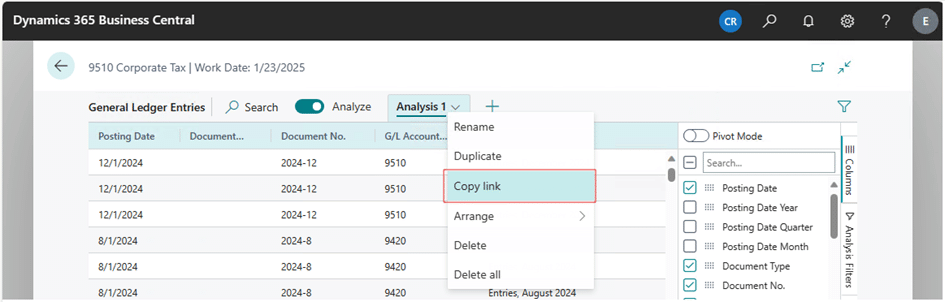
The ‘Copy link to <tab name>’ dialog box opens.
- By default, the shared analysis links to the page or query within the company you are currently working on, indicated by company=<company_name> in the URL field. If you want to share an analysis that is not linked to a specific company, set the Company field to “Not linked to a specific company’.
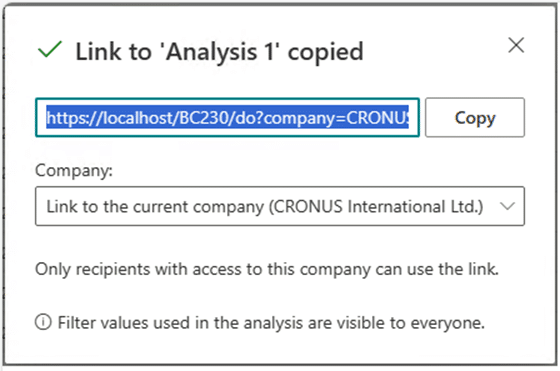
- Click ‘Copy’.
- Paste the link into your preferred communication medium, such as Word, Outlook, Teams, OneNote, etc..
- Recipients can select the link and open the analysis for the page or query in Business Central. They will be prompted to name the new analysis tab.
Data as driving factor for your logistics processes
Data is critical to logistics companies. It helps you take your logistics processes to the next level. And beyond using the Analysis Mode, there are many other ways to use your data to your advantage. Contact us and get started with your data today.