WMS


Analyze your data in seconds with Microsoft’s Analysis Mode
11 Jan 2024
4 min read
Logistics never stands still. New innovations come fast and furious. It is essential to quickly adopt new capabilities and integrate them into your business processes. Only then can you effectively support your customers’ logistics operations and maintain your competitive advantage. At Boltrics, we understand this like no other. That’s why more than 300 logistics providers have chosen our always up-to-date promise. Our solution is built on the powerful foundation of Microsoft Dynamics 365 Business Central. A platform with the familiar look and feel of Microsoft Office. And we build the logistics functionalities you need. Each update from Microsoft not only improves existing functionalities, but also adds many new features. One of those new features is Analysis Mode. A feature that Microsoft unveiled at Directions4Partners in Lyon.
So what is Analysis Mode?
Analysis Mode allows you to analyze data directly from the list views. This eliminates the need to create reports or use other applications such as Excel. The Analyze feature provides an interactive and versatile way to calculate, summarize, and explore data. Easily add multiple tabs for different tasks or views, such as “My Customers,” “Follow-Up Items,” or “Sales Statistics”. Analysis Mode is divided into five sections: data area, summary bar, columns, analysis filters, and tabs. We will describe these sections in more detail below.
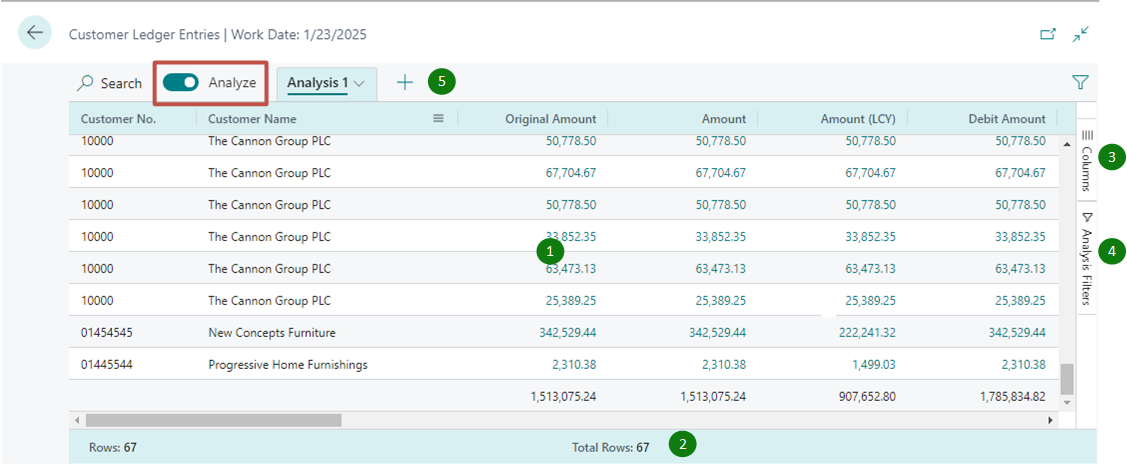
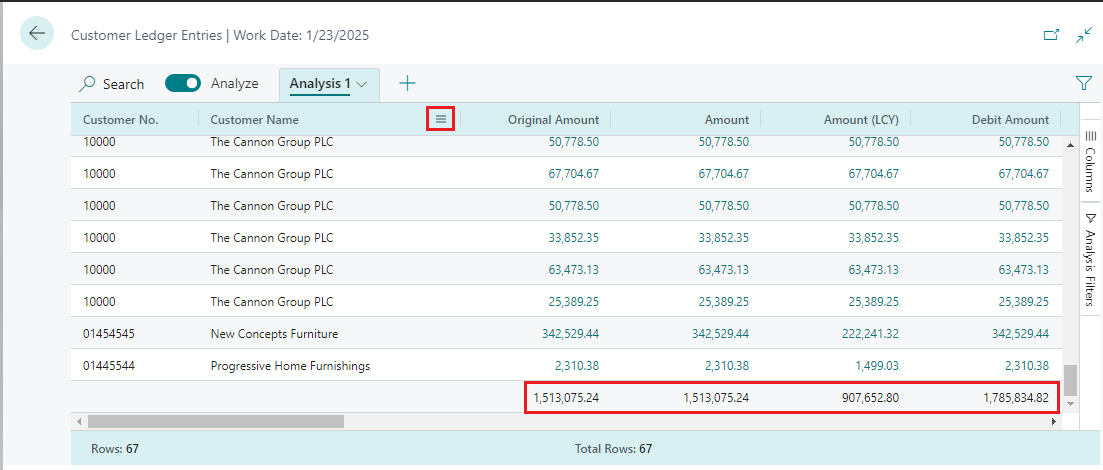
1. Data area
The data area is where the rows and columns of the List page query are displayed and the data is summarized. It provides flexibility in arranging column layouts and a quick way to get an overview of the data. For columns with numeric values, the sum of all values appears in the last row, unless you have set up row groups. In this case, the totals appear as subtotals for the groups.
2. Summary bar
At the bottom of the page is the summary bar. It displays statistics about the list page or query data. Are you working with columns whose values can be summed? Then the data is updated instantly!
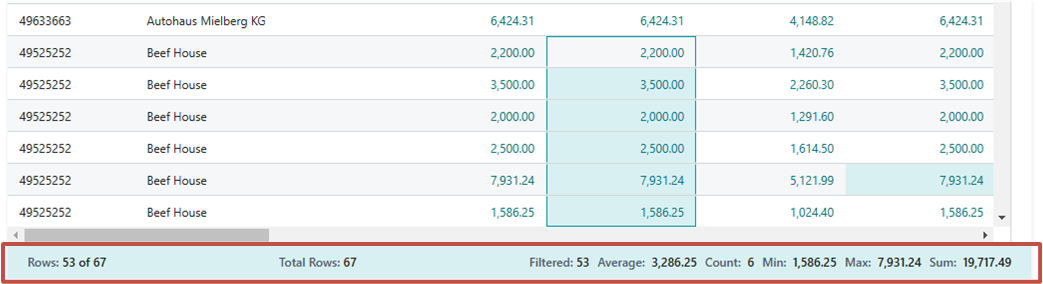
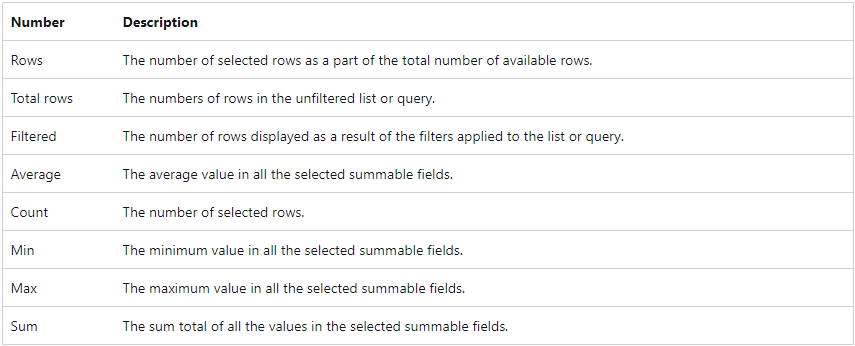
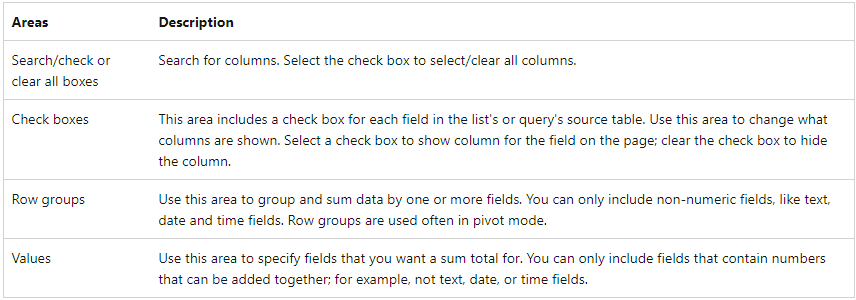
The following table describes the different numbers displayed in the summary area:
3. Columns
Dive into action with the Columns pane – the driving force behind your analysis! Together with the Analysis Filters window, it forms a power duo to shape your insights. Columns are used to summarize data. Decide which columns should take the lead in your analysis!
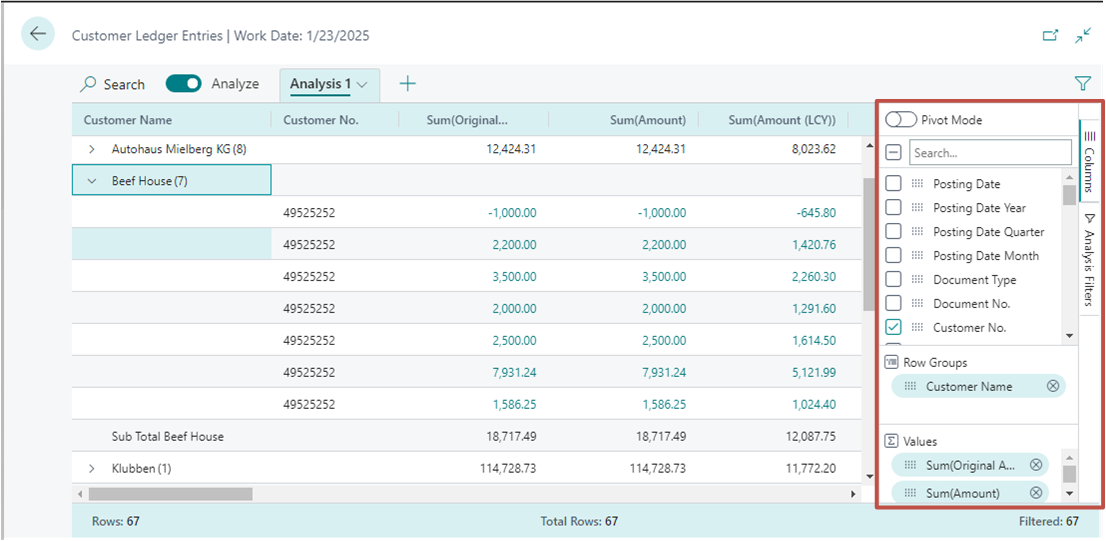
4. Analysis filters
Take control of your data with analysis filters. Limit the list items to your criteria by setting smart column filters. Whether you are looking for a specific customer or sales orders over a certain amount, you can set it here. To set a filter, select the column, choose the comparison operation from the list (such as Equals or Begins with), and enter the value.
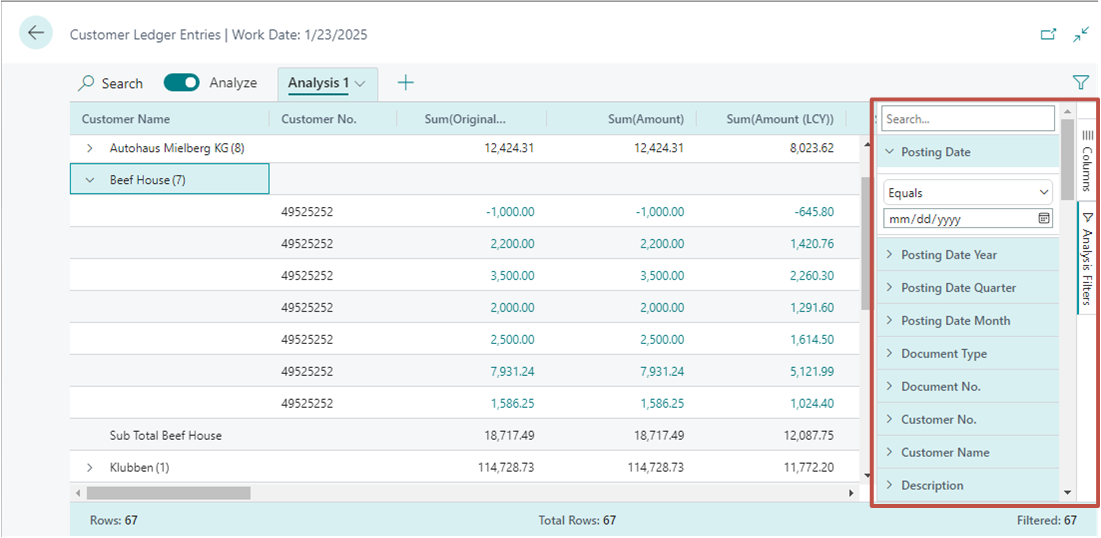
Note: The additional filters apply only to the current analysis tab. This allows you to define only the additional data filters needed for a specific analysis.
5. Tabs
Tabs allow you to create different configurations (columns and analysis filters) on individual tabs. Think of them as the tabs in your web browser. There is always at least one tab: Analysis 1. Adding tabs is useful for storing frequently used analysis configurations on a dataset. For example, you might have tabs for analyzing data in Pivot mode. And other tabs that filter by a subset of rows. Some tabs might show a detailed view with many columns, and others might show only a few key columns.
Tip: The tabs you set are visible only to you. Other users will only see the tabs they have set.
Data as driving factor for your logistics processes
Data is critical to logistics companies. It helps you take your logistics processes to the next level. And beyond using the Analysis Mode, there are many other ways to use your data to your advantage. Contact us and get started with your data today.